Political pundits often take election polls as the gospel. But are they accurate? Their impact appears quite similar to the weather report. When we make our plans strictly on the weather report, we are often disappointed. Yet, even when the weather man disappoints, we listen again the next day, pretending he was never wrong before. If right more than half the time, we shower credibility on our weather man only to be fooled again tomorrow.

Is your pollster’s record even as good as your weatherman’s? Steve Martin, in LA Story, had the easiest job in the world: weatherman in Southern California, a place where the weather rarely changes. He figured he could phone in the weather one day (big mistake): just say it will be sunny and 72 degrees in Los Angeles and you’re right just about every day. Just like the weather, we are often unprepared for the actual election results.
In many instances, the pollster’s job is no harder than Steve Martin’s in LA Story. We didn’t need polls to tell us who would win Wyoming and California in 2024. Those results were obvious from the beginning of the campaign. In fact, only seven states had any real suspense this year. Neither presidential candidate seriously campaigned in the other 43 states. Occasionally, one of them would get a notion about stealing one of their opponents safe states, but any prognosticator who stuck with the conventional logic would have correctly predicted the winner in all 43 non-battleground states. Sunny and 72 was generally the right formula in 2024.
Really Big Misses
Even when correctly predicting the winner in the not-so-competitive states, pollsters often phoned in the 2024 forecast, ala Steve Martin in LA Story. The two most recent presidential polls in New Jersey missed the mark by seven and fifteen points respectively. Did anyone notice?

Few New Jersey polls were conducted because nobody considered the state competitive. Harris won the state by 4.9%, not the 20% predicted by Rutgers University’s poll in mid-October. Harris’s margin of victory in New Jersey was less than the margin in the battleground state of Arizona (5.5% for Trump). Oops! Didn’t see that one coming.
If the weatherman misses the forecast this badly is his input still valuable?

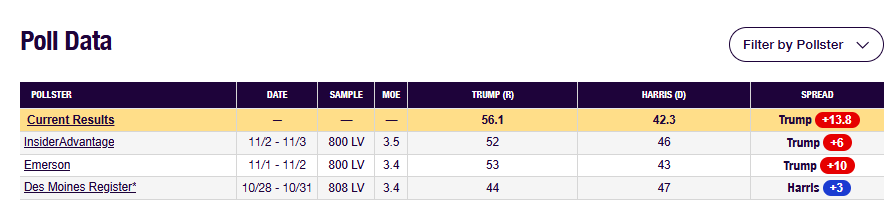
New Jersey pollsters might avoid blame by pretending the state’s mood shifted dramatically in the last days, but Iowa pollsters don’t have that excuse. The weekend prior to the election, a Des Moines Register poll predicted Harris would win Iowa. That poll overshot the mark by almost 17%. You cannot get much worse than this (although pollsters have done it to us several times before).
The Des Moines Register poll was not the only Iowa miss. The Insider Advantage poll a few days later missed by almost 8%. The Emerson College poll was closest of the three most recent Iowa polls, but missed as well. Their prediction was Trump by 10%. When accounting for the margin of error, their predicted range was between 13.4% and 6.6% (10% plus or minus the 3.4% margin of error). Trump won by 13.8%, a few tenths above the upper limit. Close, but still another miss.
No presidential polls were conducted in Alaska, Wyoming, or a slough of other not-so-competitive states. Still, there were plenty of misses in the remaining states.
In California and Texas, every single 2024 poll was outside the predicted range. OMG!
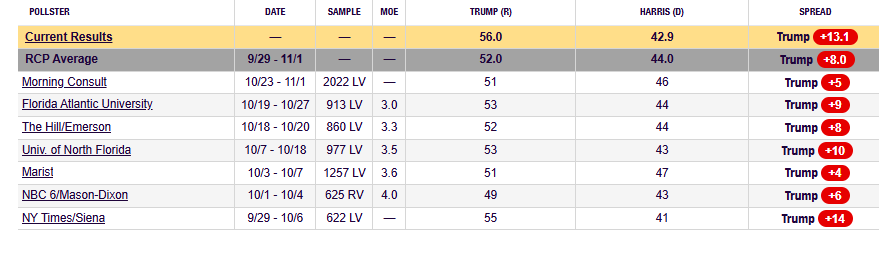
In Florida, the last seven polls missed by an average of 5.1% (actual result was Trump by 13.1%; the predicted average was Trump by 8%). Three of the Florida polls missed the actual result by more than 7%. Only two of the seven were within the margin of error. Crappy job, folks.
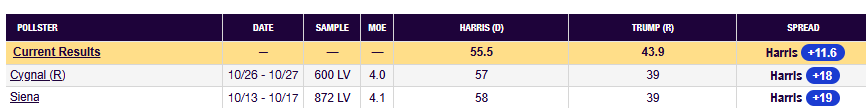
In New York, the two most recent polls missed by 6.4% and 7.4% respectively. More crap from our well respected pollsters.
What’s the Problem?
Something fishy is going on here.
Statistics is not an exact science, so we shouldn’t expect pollsters to hit the number exactly. Pollsters are telling us with 95% confidence that the actual result will fall within a predicted range. The actual result can be outside of the predicted range, but that’s rare. What should we conclude when every single poll in a state is outside the predicted range? That’s not good, is it?

Yet, the public turns to polls for easy answers during the midst of an election. Just like the weatherman, we are forgiving if pollsters come through in the crunch. We make excuses for them: they didn’t miss by much; they usually get it right; everyone has an off day. Maybe they reassure us; the prediction feels right because it is what we want to hear. We forget that false sense of security later when the actual results are in.
I am still looking for that silver lining in 2024. Which pollster told you California would move to the Right in 2024? . . . Anyone? . . . Bueller? . . . Bueller?
We think polling is a political process. Pundits dismiss certain polls because they believe them politically biased. We are told: they are just giving that number to discourage one side or another from voting. However, polling should be strictly a mathematical process. Rigid mathematical theorems say the predicted result should be within the margin of error except in rare instances. A 95% confidence interval means around 5% of the time the result falls outside the predicted range. In 2024, polls are off target nearly half the time. We can do a lot better, folks. Do not accept these results.
If done properly, a survey of a few thousand voters can indeed accurately measure the preferences of the vastly larger population. Statistics are valid scientifically, but only if not bastardized by political analysts who don’t understand the mathematics they are applying.

The pre-requisites needed to correctly apply the mathematical theory cannot possibly be met during election polling. There are no truly random samples in which every voter within the population has an equal chance of being polled. A vast number of us would rather not participate and pollsters go to their second, third, or fourth choices to obtain a response. Those willing to participate may not be representative of the entire population; they may tend to vote more in one direction than those who refuse to participate. This mathematical bias invalidates results.
Furthermore, the manner in which people are polled (phone, text, email, etc.) makes some more likely to be selected (because many may only communicate by one method and cannot participate if another method is used). Folks who do not work or do not travel extensively may be more likely to be selected if polls are conducted when others are working or traveling. Again, folks who are less likely to be polled may be more likely to vote one way or the other, and a mathematical bias is introduced. The principle that must be maintained is: all voters should have an equal chance of being selected. Pollsters cannot maintain the principle.
Pollsters may be able to mitigate the mathematical bias, but they cannot overcome it completely. The margin of error is increased with these selection biases, yet there is no way to measure that margin of error. So instead of an expected margin of error of around 3%, the real margin of error (something never calculated) is likely much higher. Nobody wants to hear from a poll reporting a 6% margin of error, but that number is more likely closer to the truth given the difficulties of polling today.
In the end, a number is always provided, and that number often “feels” right. Do you want your feelings validated or do you want a mathematically valid result? You get the former far more often than the latter.
Battleground States
Perhaps the saving grace for pollsters was that their results in the battleground states were somewhat close. Still, when you dig deeper, the numbers are not actually so good.

The RealClearPolitics polling average (of the most recent polls) predicted Harris would win Michigan and Wisconsin by slim margins. Trump was given slim margins in four other battleground states along with a somewhat comfortable lead in Arizona (2.8%). The popular vote was a dead heat (Harris +0.1%).
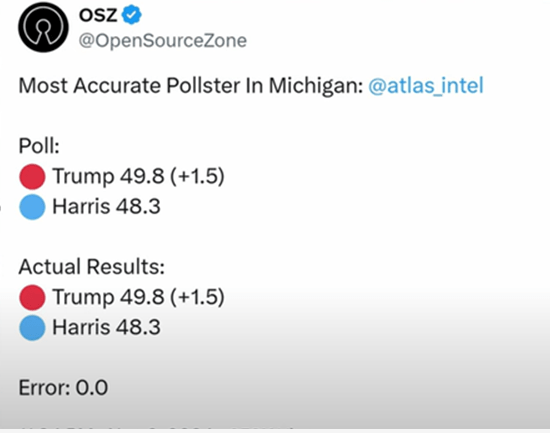
Several pundits said “the polls got this race basically right”, but I question that conclusion. The race was not nearly as close as polls led us to believe. Some individual pollsters did indeed have the numbers right (Atlas Intel accurately predicted all these races), but collectively, the pollsters missed the mark. Trump’s margin of victory, although not massive, shocked many because the polling did not prepare us for the ultimate result. https://www.dailymail.co.uk/news/article-14055825/Smile-wiped-face-cackling-professor-bought-champagne-toast-Kamala-win.html It was supposed to be a long week of counting and re-counting in the battleground states, but it was clear before Tuesday evening ended that Trump would win.
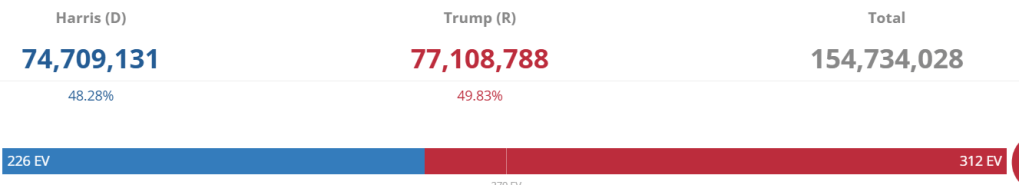
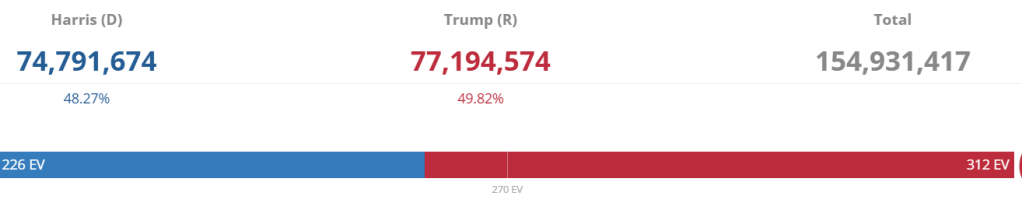
Another serious failing is that all the RCP averages (nationally and in every single state), underestimated Trump support. Trump won all seven battleground states with margins from 0.9% (Wisconsin) to 5.6% (Arizona), all short of his predicted result. Trump won the popular vote by 2.0% (2.1% miss), another important metric that underestimated his actual support.

The RCP average had Trump winning Arizona by 2.8%, an underestimate of 2.8%. In fact, eight of the latest nine Arizona polls underestimated Trump’s support. Only two of the nine polls were within the margin of error. These results are not “basically right”.
Trump won Nevada by 3.1% instead of the predicted 0.6%. It was supposed to be a nail biter. You might say this result isn’t so bad, yet, three of ten latest polls said Harris would win Nevada. Three others said the race was tied. In all, five of the ten polls were outside the margin of error. In colloquial terms: these results suck!
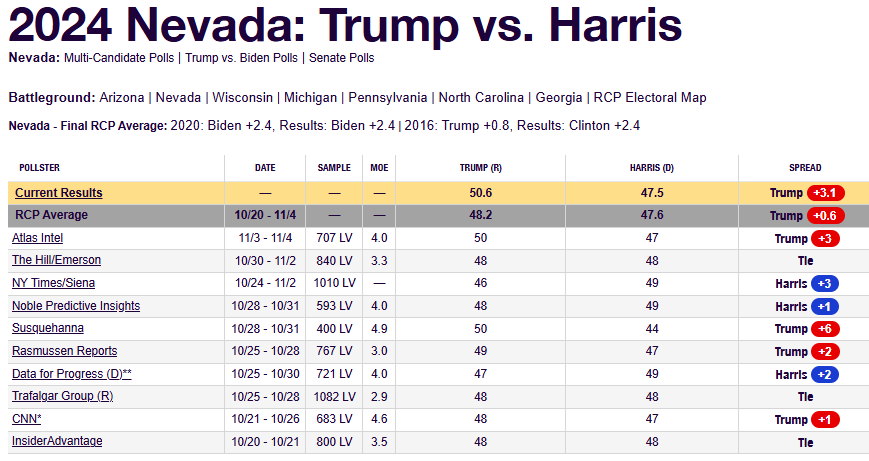
Pundits say the polls performed well, yet half the Nevada polls missed badly. Even the vaunted NY Times underestimated Trump support by 6.4%. Trump support is also underestimated in nine of ten Nevada polls. Battleground predictions were not as bad as the predictions in Iowa and New Jersey, but it isn’t good by any means.
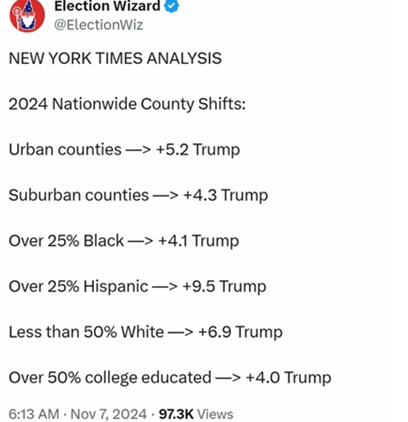
Results vary from state to state, but remarkably pollsters consistently underestimated Trump’s support: in Florida, California, New York, New Jersey, Iowa, Arizona, North Carolina, Georgia, Michigan, Nevada, Wisconsin, Pennsylvania, and more. This was the one thing you could rely on with the polls: add a few percentage points to Trump’s predicted numbers (per the poll averages) and you would inch closer to the actual result.
This underestimation of Trump support was a problem in 2016 and 2020 also. Polling methodology is definitely flawed when mistakes are always wrong in one direction.
I have no idea why this consistent error exists, but the mistakes are as plain as day to see. Perhaps, pollsters were factoring in the results from the last two presidential elections when predicting this one (this is NOT a valid mathematical practice). The results of the prior election should have no bearing on polls conducted for the current election.
The RCP average is a collective measure usually of a half dozen or more polls (this averaging tends to bring the numbers closer to the true result). The few pollsters who got results right will get gold stars and live on these laurels for a few years. Some may have been accurate because of dumb luck (if you are all somewhat close to the mark, one of you will likely hit the bullseye). Perhaps, some pollsters paid more attention to the underlying mathematical principles (I am dubious of this, but I cannot say for sure).
The entire problem, apart from political bias and psychological ops to discourage the voters on the other side, is the margin of error. The margin of error shown is not accurate because the math is ignored (who gives a damn about the math or even understands it, in any case?). The mathematical theorem says you must meet all the criteria in the hypothesis. If you don’t meet those criteria, you don’t get to make the conclusion which follows. These pollsters violate the rules of mathematics, applying the theorem invalidly, and so we get crap. The numbers look and feel accurate, but they are generally not.
Ultimately, be aware: pollsters miss their forecasts even more often than the weatherman. They are in the ballpark, but not nearly as precise as they want you to believe. Do not trust their predictions, and always vote because it is your duty and your vote may indeed make a difference even when the media tells you otherwise.
Furthermore, recognize also: a poll is simply a snapshot in time. A mid-October poll may actually reflect the views of the people at that moment, but views can change in the weeks that follow.
Early Voting Results
I watched the early voting results for weeks leading up to election day. They offered plethora of data, yet pundits said: ignore the early voting data; it is not predictive. Nonsense. Conventional wisdom fails us again.
More than half of all the nearly 152 million votes tallied thus far were early (California is still counting a week later; a few million votes are still outstanding). Early voting results did not tell us who received votes (this is prohibited by law), but they did list party affiliation, vote type (mail-in or in-person), gender, and age demographic.
Remarkably, pundits who pretend to be analysts say to trust polls which do not follow the underlying mathematical principles and obtain the opinions of maybe a 1,000 people while discounting a far more predictive sample of 82 million people. Can these political analysts think outside the box at all?
I made a few predictions the weekend before the election based on the early voting. As of Saturday, November 2:

- Popular Vote: There were equal numbers of ballots cast by Republicans and Democrats by Saturday before election day. I assumed the crossover vote (Republicans voting Democrat and vice versa) would be a wash. My assessment was Trump was running a far better campaign than Harris, so I gave him a slight edge with Independents. Republicans have won the early vote in recent elections and I believed they would probably do so again (or at least match Democrats). It seemed a safe bet to pick Trump to win the popular vote.

- Florida and Texas: By Saturday, November 2, Republicans had massive leads in Florida (43% to 33%) and Texas (51% to 37%) with 8.6 million and 7.3 million votes cast respectively. More than half of all registered voters in these two states voted early. In addition, more than 80% of all votes cast in these two states were early. I was shooting fish in a barrel to say Trump would win big in both states and Ted Cruz would be easily re-elected (despite massive dollars Chuck Schumer provided his opponent). How did the political pundits miss these obvious predictions?
- Georgia: Almost 4.1 million votes were cast early and Republicans led 48% to 45%. These percentages barely budged for a week. Close to 80% of all votes to be cast in Georgia were early. With such a large portion of the vote already cast, Democrats could not make up the difference. I predicted a Trump win Georgia by a few percent. This was the first of his pickups from 2020.
- Arizona and Nevada: In Nevada, Republicans led 39% to 35% with more than a million votes cast. Arizona had 2 million votes cast (two-thirds of Arizona votes were early) with Republicans leading 42% to 33%. I predicted Trump wins Arizona and Nevada. More fish in a barrel. These were two more 2020 pickups for Trump.
- North Carolina: By Saturday, 4.2 million votes had been cast already with very tight margins: Republicans: 34%, Democrats: 33%, and Independents: 33%. More than half of all registered voters had already voted. These numbers were steady for a week. Furthermore, this was almost 80% of the total vote cast. With the tight margin and the large number of independents, I was less certain of North Carolina. Still, I thought Independents would swing to Trump and Republicans would maintain a slight election day edge.
- Bottom line: Given the numbers above, I predicted Trump would get to 268 electoral votes. Still, 268 was not enough to win.
TX, FL, NC, and GA recorded more than 4 million early votes and so were easier to predict. Other than California (which was a lock for Harris), no other state, including the populous states of PA, OH, IL, MI, NJ, and VA, had recorded 3 million votes by the Saturday before the election. Republicans trailed in the early vote in five of six (excluding Ohio), but early voting was not definitive because of fewer early voters in these states. In addition, several of these states are more weighted to mail-in voting, a factor favoring Democrats which could be offset by Republicans on election day.
The key to the election after early voting analysis was: who would win Pennsylvania, Michigan, and Wisconsin, the Democrat “Blue Wall”? The early vote numbers were not definitive for these three states. In fact, Wisconsin was eventually decided by only 30,000 votes (the closest of all fifty races). Michigan (80,000) and Pennsylvania (145,000) margins were a bit more.
By Monday, Michigan had finally tightened with Republicans equaling Democrat margins and the total votes cast finally exceed 3 million. Michigan appeared to be in play for Republicans. In Pennsylvania and Wisconsin, Democrats still held big early vote leads, but the number of early votes was relatively small, especially in Pennsylvania (three quarters would vote on election day). The smaller vote totals made it difficult to predict these two states. Democrats had the edge going into election day (the pundits were at least correct about drawing too much from early voting numbers in the Blue Wall states).
Ultimately, early vote numbers were a treasure trove and should have been used in lieu of unreliable polls to make predictions. We need more in depth analysis of events and we need to consider party registrations and actual vote numbers to augment the fickle polls.
Update Thursday, November 14

Nine days after election date, votes are still being counted. As of November 14, California has counted just 86% of the vote. Four house races in California are undecided because they have dawdled. Washington and Oregon also have not finished, having counted 93% and 90% respectively. Arizona and Nevada are also pokey states. Results in the very tight Nevada Senate race shifted after several days of counting.
Lengthy delays lead to doubts regarding results. How hard is it to manufacture votes when you know who hasn’t voted and just enough of those ballots can be turned in a week later? Florida and Texas each counted roughly 11 million votes in less than a day. Why can’t all states?
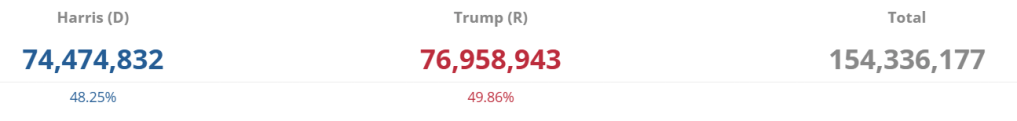
In any case, I updated the numbers above to show the latest totals. Trump’s lead in the popular vote shrunk from 2.5% this past weekend to 2% today as a few hundred thousand more California votes are counted each day. Trump will win retain his popular vote lead. He still holds a 3 million popular vote lead still with about 2 million votes left to count in California.
Ultimately, Trump will wind up with at least three million more votes than he had in 2020. Harris will fall between six and seven million votes short of Biden’s 2020 total. There is the microcosm of the election: slightly fewer votes were registered in 2024; Trump expanded his base while Harris shrunk the Democrat base.
Update Saturday, November 16

Eleven days after the election: California has counted 89% of the vote, Oregon 90%, and Washington 94%. Two California house races were called yesterday, but two more are still pending. Election month continues. Cheese whiz! Trump’s popular vote lead is roughly 2.5 million votes now (1.8% lead).
Update Tuesday, November 19
Two weeks later and California is still counting votes. They have counted 15.4 million in the presidential race with another 9% left to count. What more can be said?
In an attempt to change the result of the Pennsylvania Senate race, Democrats twice attempted to count mail-in votes with no valid signatures; they were twice rebuffed by the PA Supreme Court.
We still have some work to do to fix the election system.
Update Friday, November 22
We know now that it takes up to three weeks to count all the votes. In the last seven days more than 2.5 million votes have been added to Trump’s and Harris’s totals, most of those from California.
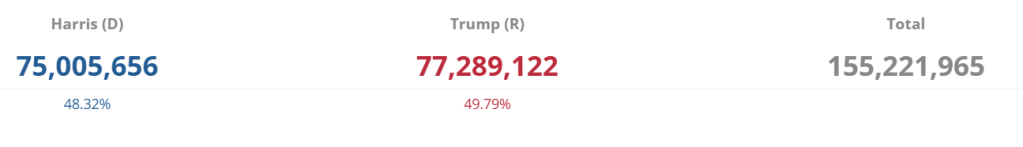
Trump still leads the popular vote by about 1.62% with roughly 77 million votes nationwide, three million more than in 2020. Harris, with roughly 74.5 million, is 6.5 million below Biden’s 2020 total.
Probably, the numbers change relatively little from here on out.
There are still two U.S. House races to decide in California because the state says there are still more to counted. It’s the weekend now, so we must wait a bit longer for the final result. We see the shift to the Right more pronounced in the popular vote for the U.S. House with Republicans holding a 3% margin.

One final interesting statistic is that several polls have measured Trump’s favorability above 50%, one as much as 54%. Trump started his 2016 term with only 45% approval rating. He never rose above 47% in four years.
These results show dramatic shifts. Trump’s and Republican’s increase in numbers coupled with Harris’s decline is the story of the election. It leads to much interesting speculation, something to cover in a future post.
Update Wednesday, November 27
Nationwide, almost 400,000 more votes have been added since Friday. Two house races in California are still undecided.
When does the counting finish?
Lake County, California may take the prize for the slowest counter. Should we allow them until Christmas to finish?
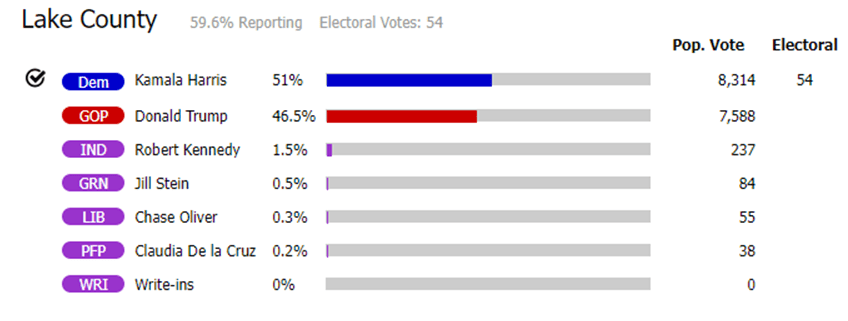
Final Count? Tuesday, December 3, 2024
Another 200,000 votes have been tallied nationally since last Wednesday. The pace of change is very slow, but where are they coming up with more votes four weeks after the election? It really gives me pause regarding the integrity of our elections.
Sunday, December 8, 2024
Another 300,000 votes were counted in the last five days. Almost five weeks after the election and the votes are still being counted. What does this mean?
Dave https://seek-the-truth.com/about/
https://seek-the-truth.com/category/elections/
https://seek-the-truth.com/
